|
The activities of HXAL consist of operation, maintenance and user support on two hard x-ray based beamlines on Indus-2 synchrotron source in the photon energy range of 4 keV to 22 keV as well as in-house microfabrication research and development.The scientists are also engaged in significant in-house research in the field of modern oxide materials, naomaterials, high pressure materials characterization experiments, XRD characterization of strategic materials, oxide thin films and multilayers, microfabrication, MEMS/MOEMS, piezoelectric actuators and deformable mirrors for Adaptive optics activities etc..
Beamline activity:
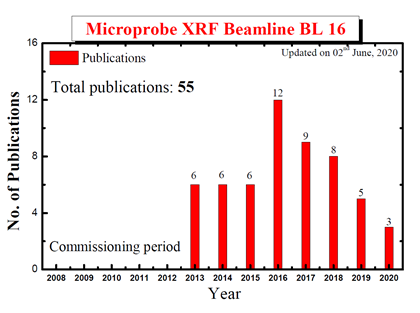
The team provides overall support from experiments planning to data analysis on following beamline.
Research Highlights
The team is engaged in different research activities which includes work on oxides (Perovskites, Delafossites etc), Perovskite based Solar cells, thin films etc.
(i) BaFeO3:
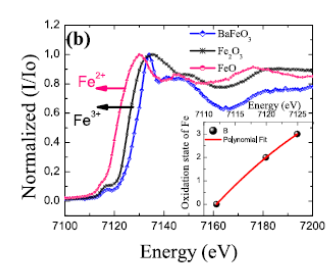
BaFeO3 is an interesting perovskite, with Fe in +4 oxidation state which exhibits charge disproportionation and anti ferromagnetism at low temperatures. However, dielectric studies on bulk BaFeO3 and their possible correlation with the magnetic properties are rare. Our structural, dielectric and magnetic measurements indicate that in this sample the charge/orbital and spin degrees of freedom are coupled and may lead to possibility of magneto-dielectric coupling in such materials.
|
|
Figure: XANES measurements performed on the Fe K-edgeof the sample and two standards. Inset represents a plot of energy vs oxidationstate of Fe, shows that the Fe in the sample is in mixed oxidation state of Fe+3 and Fe+4. |
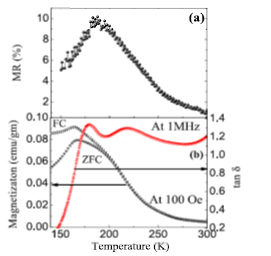
Figure: Simultaneous plots of (a) magneto-resistance (top) and (b) magnetizationdata (left) and the dissipation factor (right) clearly show the transition temperature in magnetization data and peak in magneto-resistance coincides with the temperature at which a sudden drop in the dissipation factor transpires. |
| Archna Sagdeo et al., Appl. Phys. Lett.105, 042906 (2014) |
(ii) BaTiO3:
In perovskite ferroelectrics, oxygen vacancies are one of the most common defects, which affect the physical properties of the system. It has been suggested by both theory and experiments that oxygen vacancies are the strongest perturbation to the perovskite lattice, which causes a collapse of the perovskite structure. By increasing oxygen vacancies in the system, itinerant electrons are introduced into the material, and hence, it is known to become conducting with increased oxygen deficiency, exhibiting insulator-metal.
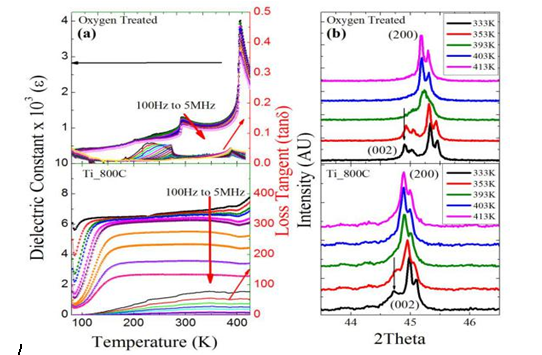
We show that all the samples had nearly the same band gap, but the oxygen-deficient sample shows no dielectric anomaly or ferroelectric loop. “When ferroelectricity isn’t visible within the sample and the dielectric anomaly has disappeared, the structural phase transition should also vanish. But this structural transition persists.”
|
Figure: (a) Dielectric constant and dielectric loss as a function oftemperature at various frequencies from 100 Hz to 5MHz for as-prepared and oxygen deficient samples, respectively. (b) Merging of (002) and (200) peaks in temperature dependent x-ray diffraction measurements, a signature of tetragonal to cubic transition, in as-prepared and oxygen deficient samples, respectively. Archna Sagdeo et al., J.Appl. Phys. 123, 161424 (2018) |
iii) CuFeO2:
As one of the type II multiferroics, and as a member of the delafossite family, CuFeO2 (CFO) has received substantial attention due to the presence of structural transition, magnetic phase transitions, and spontaneous spin-lattice coupling properties. Delafossites with an ABO2 structure are a moderately well recognized group of materials. CuFeO2 exhibitsa multitude of magnetic phases that might be related to structural changes. transitions are accompanied by two structural phase transitions,from the hexagonal to the disordered phase and then tomonoclinic symmetry, showing the strong spin-lattice coupling.
Dielectric properties, measured at a temperature range of 84–450 K, well above the magnetic transition temperature, reported for this system, exhibit colossal dielectric permittivity with clearly distinguishable grain and grain boundarycontributions. It has been found that both short-range and long-range motions of charge carriers are present in the sample, with the shortrangemotion dominating at low temperatures and long-range motion dominating at high temperatures. It has also been observed that theconduction in the sample is dominated by the conduction through the grain boundaries.
|
Figure: (a) Variation of dielectric permittivity and (b) loss tangent as a function of temperature at different frequencies. Inset (α) shows the variation of dielectric permittivity and loss tangent at 1.5 MHz and 3 MHz. Inset (β) shows the Arrheniusplots corresponding to the relaxation peak observed at low temperatures.Inset (γ) shows the Arrhenius plots corresponding to the relaxation peak observed at high temperatures. [Preeti Pokhriyal et al., J. Appl. Phys. 125, 164101 (2019)] |
Nano materials
Synthesis, characterization and applications of Si nano-particles: Silicon (Si) nanoparticles (size < 100 nm) can show many exciting properties which are different from those of the bulk. Recently, these particles have attracted huge interest due to their potential applications in optoelectronic devices, and also the splitting of water by its reaction with Si to produce hydrogen is of great interest in energy storage, catalysis, fuel cell and medical applications. We carry-out synthesis of Si nano-particles by ball-milling and characterize them by different tools such as synchrotron XRD, XPS and TEM to get insight of their properties which can be instrumental for their usage in range of applications, such as in opto-electronics and hydrogen production from water for fuel cell applications.
Structure of amorphous materials:
Amorphous materials may show short and intermediate range ordering. In order to study these, we need high Q XRD measurements, to do Fourier transform to obtain real space information. We have expertise in taking data and analysis of XRD data on amorphous materials.
|
Figure: XRD pattern of amorphous material showing cohernt and incoherent contributions to total scattering [A. K. Sinha et al. Appl. Phys A, 2015] |
Resonant XRD
Tunability of the Synchrotron radiation can be utilized for performing resonant/anomalous x-ray measurements at the absorption edge present for a particular metal, in the sample, to explore some of the structural aspects which many a times is not possible through normal x-ray diffraction.
GaAs crystal: As an example of anomalous diffraction, we have studied the crystallographic polarity of GaAs single crystal. This was determined using anomalous x-ray diffraction at and around the Ga K-edge. We measured the intensity of GaAs (111) plane reflection between 10,340eV and 10,350eVacross the Ga K edge, on the two surfaces of the crystal. Figure shows the normalized diffractionintensity of GaAs (111) and (-1,-1,-1) surfaces plotted as a function of photon energy for the two surfaces of the crystal (marked surface 1 and surface 2).
|
Figure: Anomalous x-ray diffraction on GaAs (111) and (-1-1-1) faces. [A.K. Sinha et al., J. Phys.: Conf. Ser. 425, 072017 (2013)] |
Spinal materials:
Spinel structures (inverse or direct) like Fe3O4 and Co3O4 consists of FCC positions for ligand and TM occupies two octahedral and one tetrahedral positions. Charge states are both 3+ and 2+. The general formula unit can be written (say for Co1.5Fe1.5O4) as (CoxFe1-x) [Co1.5-yFe0.5+y]O4. Changing x may not change the XRD intensities of planes because Co and Fe are neighbours in periodic table and the scattering cross sections of the two are about the same. At resonant wave-length corresponding to either Fe or Co, changes the scattering cross section of one of the atoms and hence the two can be distinguished . We have used resonant XRD to obtain the formula unit of a mixed spinel oxide (Cobalt ferrite)
|
Figure: Calculated curves of normalized intensities of various Bragg planes: (111) {square}, (220) {circle}, (222) {triangles}, (400) {inverted triangle}, for Cobalt ferrite sample. The curves have been re scaled to accommodate all the curves in one plot. Normalization have been performed by intensity of (311) Bragg peak, which happens to be the most intense Bragg peak. Solid circles show corresponding (normalized and re scaled) measured Bragg intensities. [M. N. Singh et al., AIP Advances 5, 087115 (2015] |
X- ray Fluorescence Activity
XRR and GIXRF analysis of oxide thin film and multilayer
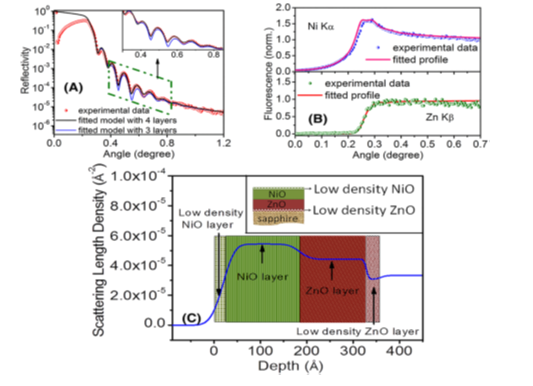
Transition metal oxides, NiO and ZnO, thin films are being utilized for formation of optoelectronic devices such as LEDs, UV photodetectors, transparent solar cells, etc. The performance of these thin-film devices strongly depends on its surface and interface properties. We use Pulsed laser deposition (PLD) technique for deposition of these thin films and their crystalline quality is being examined by X-ray diffraction (XRD) measurements. The determination of microstructural parameters and analysis of quality of surface/interfaces for these thin film structures is carried out using non-destructive combined X-ray reflectivity (XRR) and Grazing incidence X-ray fluorescence (GIXRF) technique.
|
Figure : Measured and fitted (A) X-ray reflectivity (XRR), (B) angle-dependent Ni–Kα fluorescence profile and Zn–Kβ fluorescence profile originated from NiO/ZnO bilayer structure at 12 KeV X-ray energy. (C) Scattering length density profile obtained from the best fitted XRR data. A schematic model of the NiO/ZnO bilayer structure estimated from the best fit experimental data is depicted in the inset of C. |
In addition, X-ray standing wave (XSW) assisted XANES (X-ray absorption near edge spectroscopy) measurements were also carried out for depth dependent chemical speciation of the metallic element inside thin film structures.
MEMS related activitie
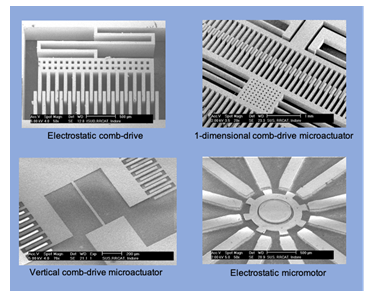
Microfabrication and development of MEMS/MOEMS
Micro-Electro-Mechanical Systems (MEMS) and Micro-Opto-Electro-Mechanical Systems (MOEMS) are being developed to cater the in-house requirements of manipulation of SR and laser, seismic activities and others. The simulation of the designed MEMS and MOEMS are being done in COMSOL Multiphysics. Microfabrication is done by UV lithography, X-ray lithography, photo-chemical machining and LIGA.
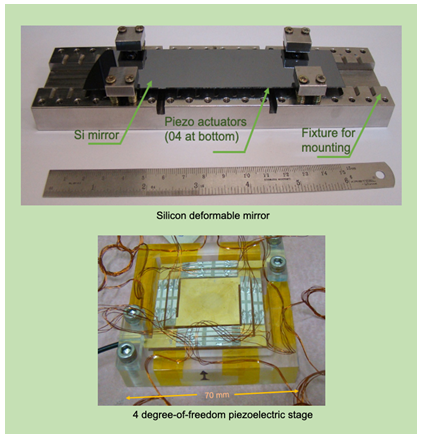
Piezoelectric Actuators and Deformable Mirrors for Adaptive Optics
Piezoelectric actuators are very advantageous for the shape control of deformable reflecting mirror surfaces in the SR beamlines and free electron lasers (FEL) for obtaining aberration free focusing and, variable focal spot shape, size and intensity of X-rays, at the experimental station. Various piezo actuator based deformable mirrors are being designed and developed on priority basis for BL-12 and BL-16. The optimization and simulation of the deformable mirrors are being done in COMSOL Multiphysics. The fabrication and characterization of those mirrors are being done at RRCAT. In addition, multi-degree-of-freedom piezoelectric stages are being developed for the manipulation of light for varieties of applications.
|


![Variation of dielectric permittivity and (b) loss tangent as a function of temperature at different frequencies. Inset (α) shows the variation of dielectric permittivity and loss tangent at 1.5 MHz and 3 MHz. Inset (β) shows the Arrheniusplots corresponding to the relaxation peak observed at low temperatures.Inset (γ) shows the Arrhenius plots corresponding to the relaxation peak observed at high temperatures. [Preeti Pokhriyal et al., J. Appl. Phys. 125, 164101 (2019)]](images/cufeo2.PNG)
![XRD pattern of amorphous material showing cohernt and incoherent contributions to total scattering [A. K. Sinha et al. Appl. Phys A, 2015]](images/xrd_pattern.PNG)
![Anomalous x-ray diffraction on GaAs (111) and (-1-1-1) faces. [A.K. Sinha et al., J. Phys.: Conf. Ser. 425, 072017 (2013)]](images/reso_xrd.PNG)
![Calculated curves of normalized intensities of various Bragg planes: (111) {square}, (220) {circle}, (222) {triangles}, (400) {inverted triangle}, for Cobalt ferrite sample. The curves have been re scaled to accommodate all the curves in one plot. Normalization have been performed by intensity of (311) Bragg peak, which happens to be the most intense Bragg peak. Solid circles show corresponding (normalized and re scaled) measured Bragg intensities. [M. N. Singh et al., AIP Advances 5, 087115 (2015]](images/spinal.PNG)