 Photonic Materials Technology Section (PMTS)
Optical and Glass-Ceramic Laboratory
Basic Research in ferroelectrics, piezoelectric and multiferroic ceramics
Relaxor Ferroelectrics
Photonic Materials Technology Section (PMTS)
Optical and Glass-Ceramic Laboratory
Basic Research in ferroelectrics, piezoelectric and multiferroic ceramics
Relaxor Ferroelectrics
Relaxor ferroelectrics (RFEs) belong to a special class of ferroelectric materials, which have attracted incredible attention of scientific community for the last half century due to their extraordinary dielectric, piezoelectric, electromechanical, electro-caloric, and pyroelectric properties, which make it technological important materials for piezoelectric/electrostrictive actuators, sensors, and as electro-optic and photorefractive elements. Number of relaxor materials are fabricated using solid state route and their structure property correlations are established.
1. Material Investigated: Lead Magnesium Niobate (PMN)
Unsolved Issues: It was not clear at what temperature the chemical ordered regions (CORs) appear and how the size of the CORs correlate with the sintering temperature and polar nano regions (PNRs).
Issues solved: Present investigation concluded that the CORs are formed as soon as perovskite phase is formed during calcination because
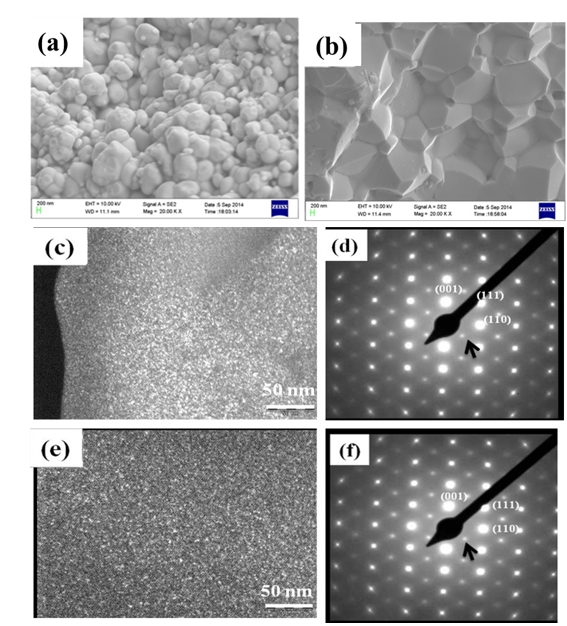
- Presence of (½½½) superlattice reflections along <111> in <110> zone axis SAED pattern, in 800 °C hot pressed PMN (Figure 1).
- Size of the CORs remain invariant with increasing sintering temperature
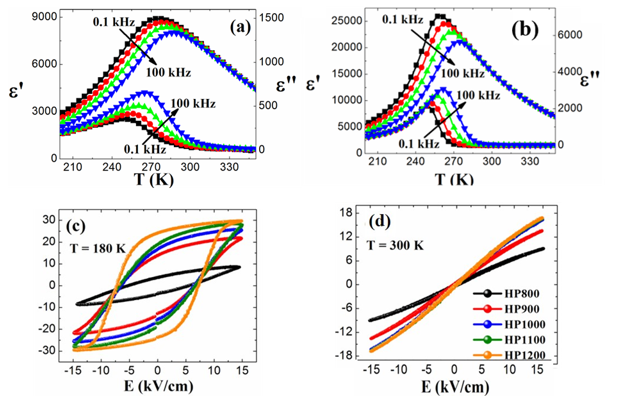
- Increase in the εm from 8000 to 25000 (shifting of the Tm from 278 K to 263 K)
- Increase in the Pmax from 9 to ~17 μC/cm2, implies increase in the size of PNRs and their co-operative interaction (Figure 2)
|
Figure 1: Comparison of the Scanning Electron Microscopic image (a,b), selected area electron diffraction along <110> unit axis (d,f), dark field images (c,e), for hot pressed PMN at 800 (HP800) and 1200 °C (HP1200). |
|
Figure 2: Dielectric (a, b) and ferroelectric (c, d) properties for HP800 and HP1200 ceramics. |
2. Material Investigated: Lead Magnesium Niobate (PMN)-lead zirconate / lead titanate solid solution
Unsolved Issues:
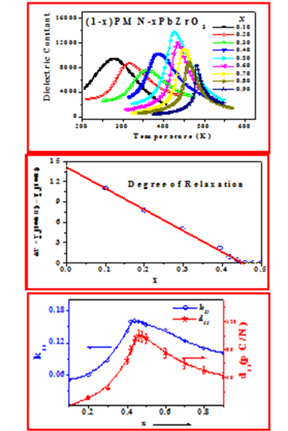
- Mechanism of relaxation and relaxor to normal-ferroelectric transformation and
- shape memory effect was not reported
Solved Issue:
- A cross-over from relaxor to normal ferroelectric transformation in the composition range 0.42 < x < 0.46, where the piezoelectric (d33) and electromechanical (k31) coefficients were maximum (Figure 3).
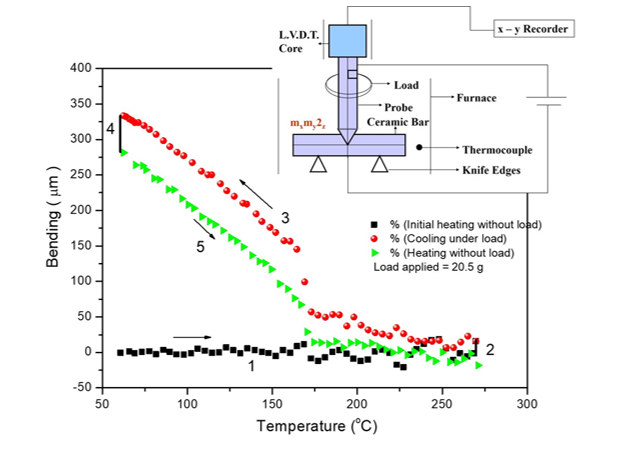
- Shape-memory strain in thin bars of PMN-PT ceramic for compositions near its morphotropic phase-boundary.
- Maximum pseudo-plastic strain measured was ~ 0.3% in 65/35 PMN-PT (Figure 4).
|
Figure 3: Dielectric, Relaxational and electro-mechanical behaviour of (1-x)PMN‒PbZrO2 system |
|
Figure 4: Pseudo-plastic strain measurement in 65/35 PMN-PT |
Lead free environment friendly ceramics:
Material Investigated: Sodium bismuth titanate Na0.5Bi0.5TiO3 (NBT) and modified barium titanate
Unsolved Issue: Structure property correlation
Solved Issue:
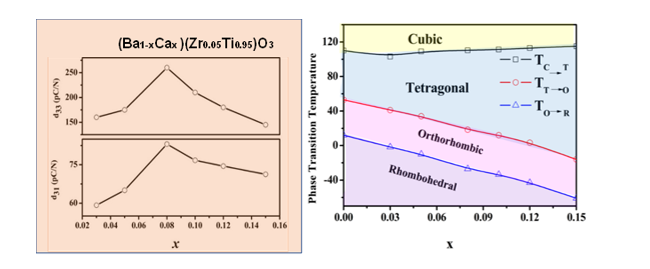
- Piezoelectric and electro-caloric coefficients were enhanced by nearly 30 and 50% for optimum Ca content of 8 mol% (Figure 5).
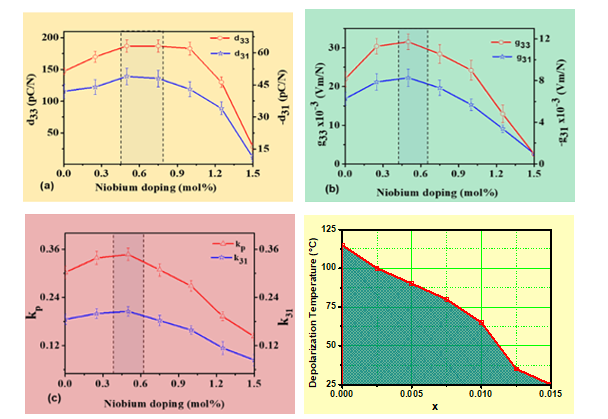
- A 20 to 25% increase in the piezoelectric properties of (Na0.41K0.09 Bi0.5)TiO3 with 0.5 at% doping of Nb+5 ion (Figure 6).
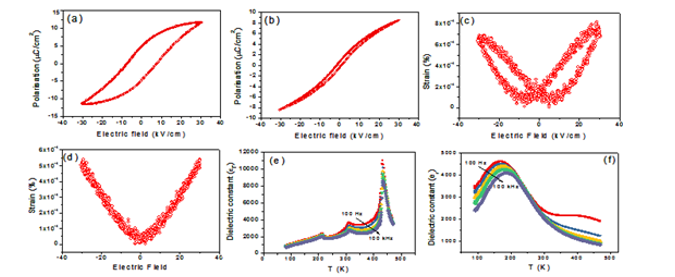
- Temperature dependent dielectric properties in alio-valent substituted barium titanate (Ba1-yKyTi1-xNbxO3) compositions (x = y = 0, 0.05, 0.075 and 0.15) has revealed (a) change in ferroelectric behavior to typical relaxor behavior and (b) maximum ~ 0.06% electrostriction strain with almost no hysteresis loss (Figure 7)
|
Figure 5: Piezoelectric and phase transition temperature dependence on composition |
|
Figure 6: Piezoelectric properties variation of (Na0.41K0.09Bi0.5)TiO3 with Nb5+ doping |
|
Figure 7: Effect of 7.5 at% alio-valent substitution in barium titanate (Ba1-yKyTi1-xNbxO3, x = y) on polarization (a-b), field induced strain (c-d) and temperature dependent dielectric constant (e-f). |
Multiferroics:
Recently, magnetic ion (transition metals or rare-earths) doping in ferroelectric ceramics is being investigated intensely in order to add new functionality namely magnetism to make it multiferroics. The multiferroics are single phase compounds or multiphase composites, which possesses simultaneously two or more primary ferroic orders viz. ferroelectric, ferromagnetic and ferroelastic. At present, multiferroic materials are gaining lot of attention due to its technological importance and scientific challenges as magnetism and ferroelectricity are two independent phenomena.
Materials fabricated: Gd-doped PMN and lead cobalt niobate ceramic (PCN)
Unsolved Issue: How magnetism develop in these ceramics were not known
Solved Issue: Gd-substituted PMN Pb1-xGdx(Mg1+x/3Nb2-x/3)O3 (0 ≤ x ≤ 0.1) ceramics has revealed
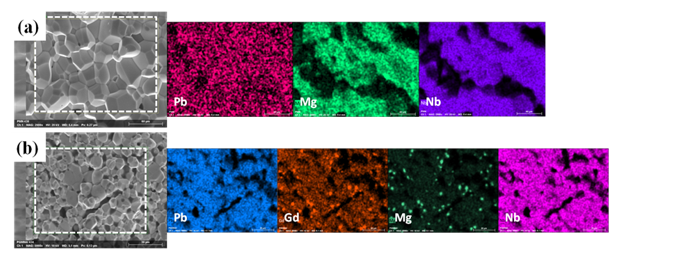
- Segregation of second GdNbO4 and MgO phases for x ≥ 0.05, (Figure 8)
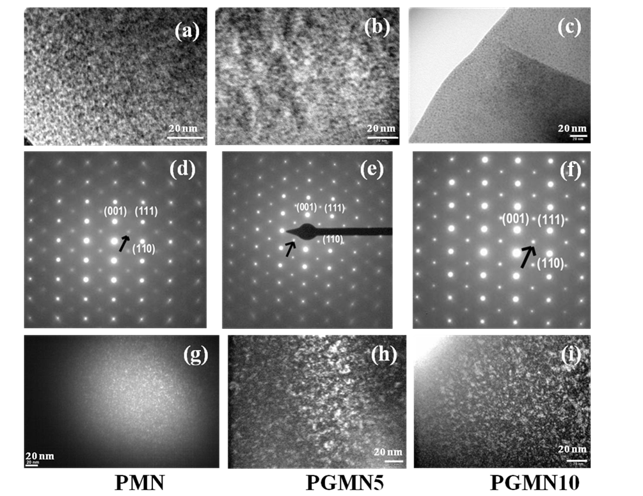
- Enhancement in size of the CORs and reduction in size of PNRs (Figure 9)
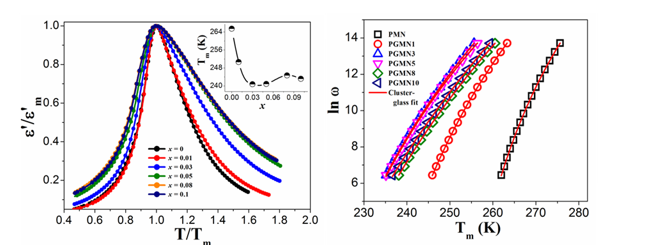
- Critical slowing down of PNRs ensemble resulting to a super-dipolar glass state (Figure 10).
- Temperature and field induced magnetization M(T/H) investigations revealed paramagnetic behaviour (Figure 11).
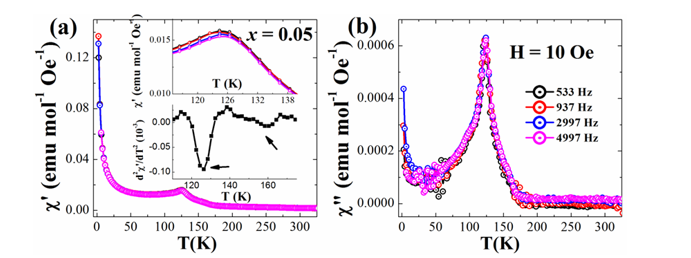
- Magnetization and magnetodielectric (MD) study has revealed few very small sized correlated regions where Gd-ions are present at the A-site and B-site in the same lattice (Figure 12).
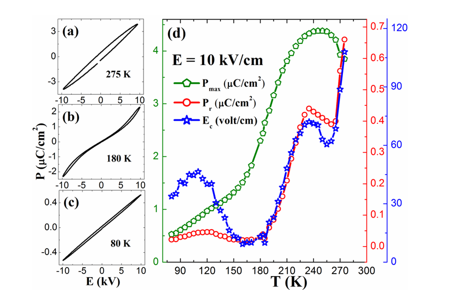
- Re-enterant relaxor behavior is observed in PCN due to development of weak anti-ferromagnetic correlations around 150 K in PCN (Figure 13).
|
Figure 8: SEM micrograph of the fractured surface of (a) PMN, and (b) Gd-doped PMN ceramic sample along with Pb, Gd, Mg, and Nb elemental mapping showing uniform distribution of these ions in the perovskite grains and presence of the GdNbO4 and MgO phases. |
|
Figure 9: Comparison of the bright field images (a)–(c), selected area electron diffraction along <110> unit axis (d)-(f) and dark field images (g)-(i) for PMN, PGMN5, and PGMN10 ceramics. The presence of superlattice reflection along ½<111> axis is shown by an arrow. |
|
Figure 10: Comparison of the ε’(T)/ε’m(T) versus T/Tm curves at 1 kHz frequency for different “x”. Inset of figure depicts the variation of temperature of dielectric maxima (Tm at 1 kHz) with “x”. All PGMN ceramics fitted by critical slowing down dynamics with bounding zv high value to ~14, where open symbols represent the temperature of εm (Tm) in the frequency range of 0.1–100 kHz and the red dotted line is fitting to cluster glass model. |
|
Figure 11: M-H curve of Gd-substituted PMN ceramics [Pb1-xGdx(Mg1/3Nb2/3)1-x/4O3 for x = 0.01 to 0.1] at a) T = 300 K, b) T = 5 K; upper inset shows normalized M/Mo vs μoH/T plot of Gd-PMN ceramics fitted by Brillouin function and lower inset depicts the enlarge view of M-H hysteresis plot of 1Gd-PMN and 10Gd-PMN ceramics. |
|
Figure 12: Temperature dependence of (a) real (x’) and (b) imaginary (x’) parts of ac magnetic susceptibility at H = 10 Oe field and at different frequencies; upper inset shows enlarged view of x’ around the peaks and lower inset depicts the second derivative plot of x’ for 5Gd-PMN ceramic sample. |
|
Figure 13: P-E hysteresis of PCN ceramic sample at different temperatures, (a) 275 K, (b) 180 K and (c) 80 K, (d) Temperature dependence of Pmax, Pr and Ec of PCN ceramic sample for E = 10 kV/cm applied electric field. |
|


![Figure 11: M-H curve of Gd-substituted PMN ceramics [Pb1-xGdx(Mg1/3Nb2/3)1-x/4O3 for x = 0.01 to 0.1] at a) T = 300 K, b) T = 5 K; upper inset shows normalized M/Mo vs μoH/T plot of Gd-PMN ceramics fitted by Brillouin function and lower inset depicts the enlarge view of M-H hysteresis plot of 1Gd-PMN and 10Gd-PMN ceramics.](basic_ferro_11.png)