| Controls, Diagnostics and Beamline Instrumentation Division |
| Control System for Vertical Test Stand (VTS) |
| |
|
The VTS facility at RRCAT is used for characterization and qualification of Superconducting RF cavities at 2K temperature. Here the bare cavities are tested at low RF-power. In order to make the various parameters related to cryogenics, vacuum, radiation etc. available to the operators and to enable them to set values in the field, a Control System has been developed & installed and a Control Room has been set up. The system graphically shows the present data and also logs the process data for later retrieval and analysis. The control system is being used since 2014 during testing of SCRF cavities in this facility.
(1) Control System features:
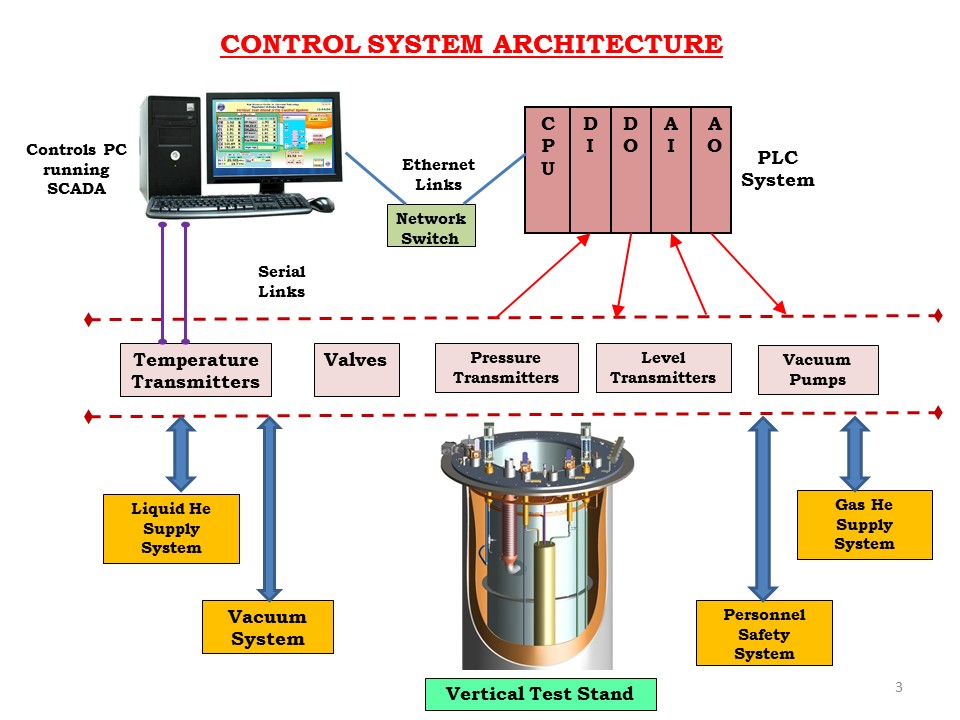
- Two tier architecture: Layer-1 has PC for GUI for Process & Devices monitoring and Layer-2 has PLC for Data acquisition, Control & Interlocks. In addition to this few instruments directly interface to PC over serial links. The scheme is shown in Fig.1.
- Communication: Ethernet(TCP/IP) & Serial (RS-232)
- Devices: Temperature transmitters, Pressure transmitters, Level Sensors, Valves, Radiation Monitors etc.
- Parameters: Related to Liq N, Liq He, Gas He, Vacuum line, Radiation Monitoring systems etc.
- Interlocks: For Liquid He line, Vacuum and Radiation Safety.
|
 |
 |
| Fig.1: Scheme of Control System |
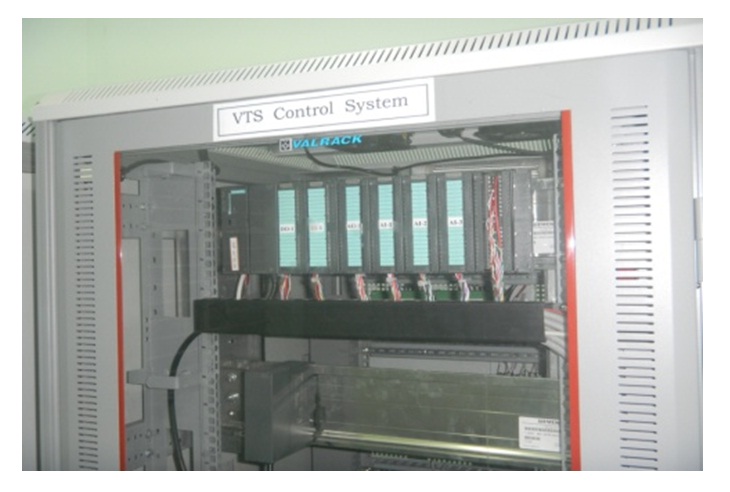
Fig.2: Control's PLC Rack |
| |
(2) Hardware Scheme
Hardware used is Siemens S7-300 Family of PLC CPU and I/O Modules, as shown in Fig.2. The software used to configure and program the PLC is Siemens STEP-7. Ladder logic programming is used to implement various logics.
Following devices have been integrated with the Control system:
- Lakeshore make temperature monitors for Cernox sensors.
- PT-100 temperature sensors
- AMI make Liquid Helium Level sensor
- PLA make Gamma radiation monitor.
(3) Software Scheme
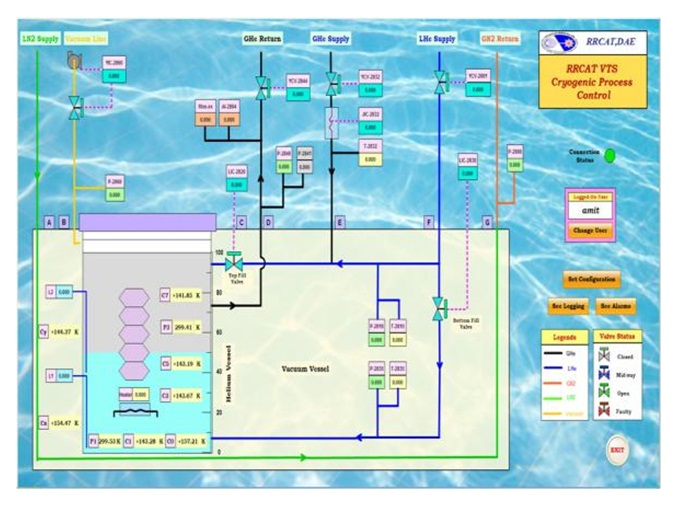
Siemens SCADA WinCC has been used for designing the Graphical User Interface (GUI) for the Process and Instrumentation (P&I) Diagram as shown in Fig.3 :
Features :
- User Authentication.
- Online display of process parameters
- Data logging in SQL database.
- Action Logging in Log-File.
- Color changing of process objects as per their states.
- Data trending in graph format.
- Warning and Alarm logging in table format.
- Warning and Alarm pop-up message displays.
- Configuration setting using User-Archive.
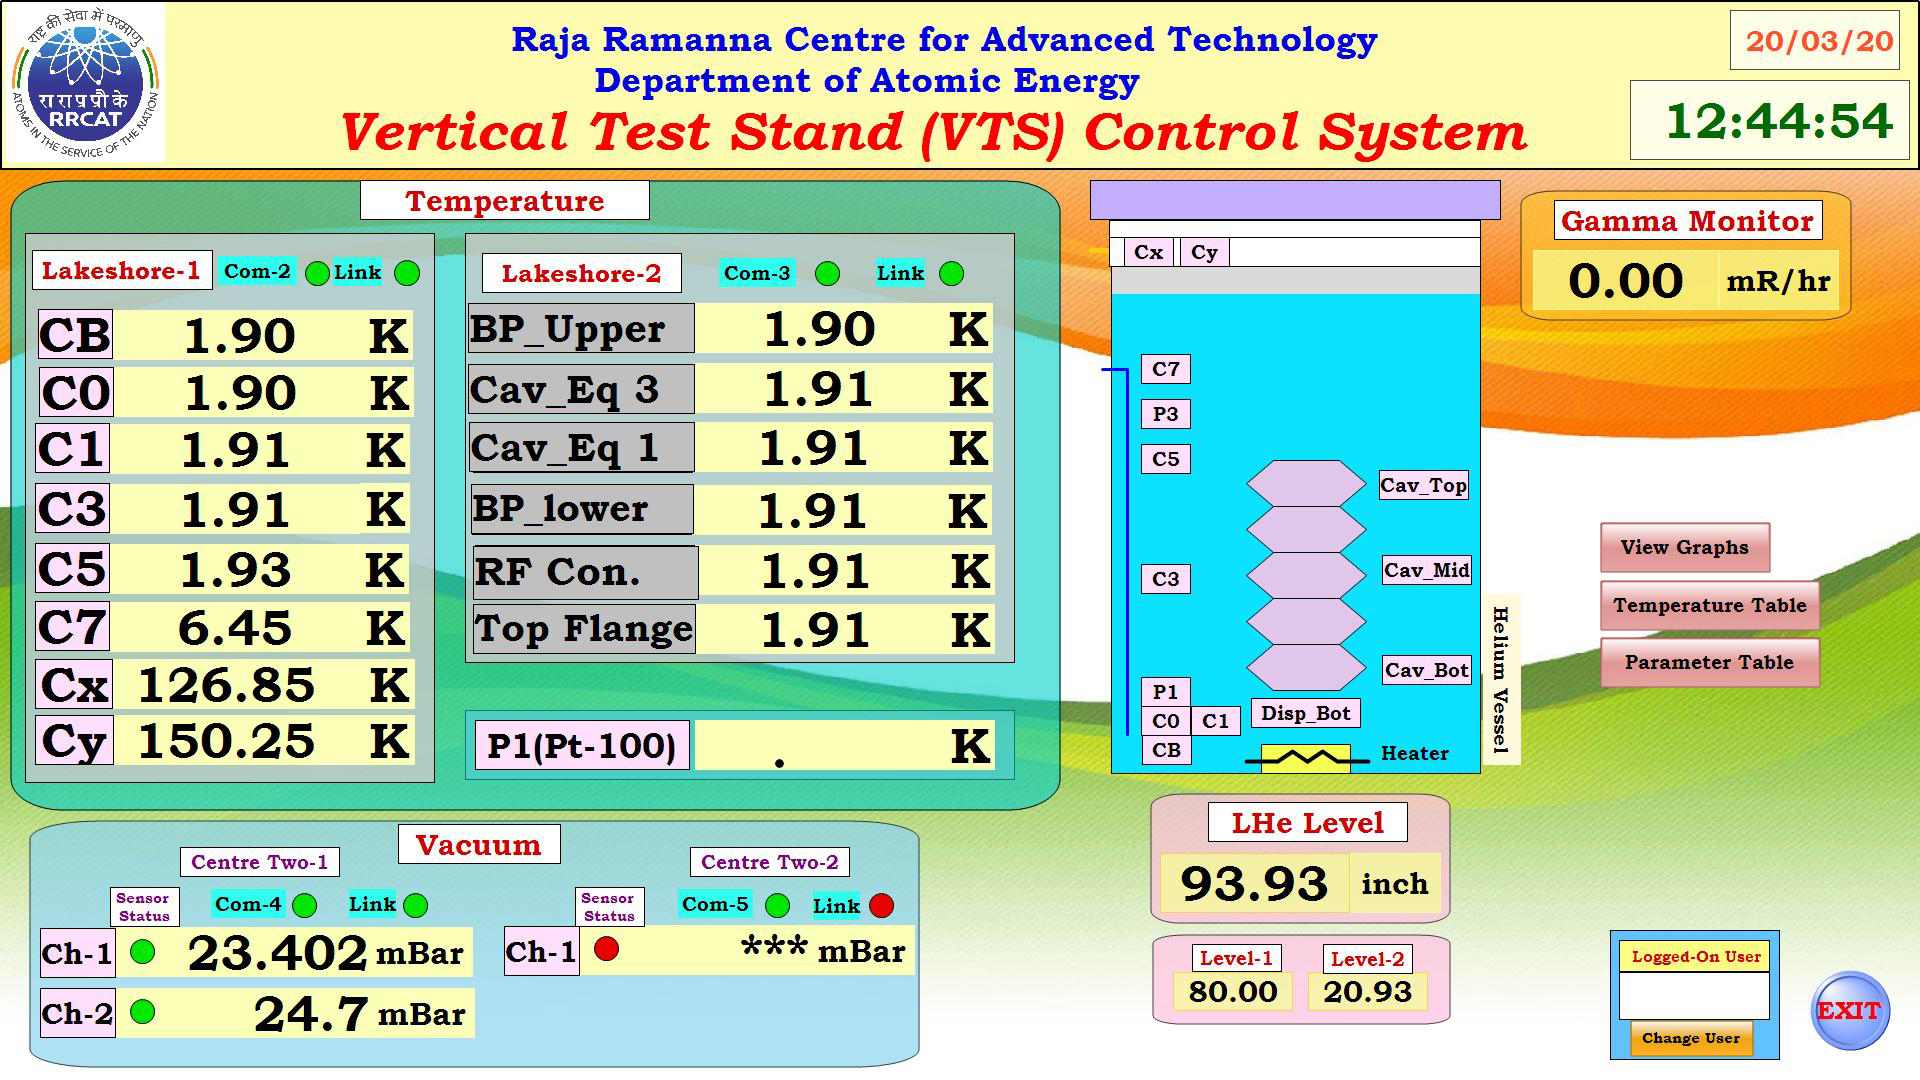
Presently the VTS setup is operated in semi-manual mode and mainly temperature, level and radiation are observed and recorded. For this another version of GUI has been developed as shown in Fig.4
|
 |
 |
| Fig.3 : Snapshot of P & IGUI |
Fig.4 : Snapshot of GUI |
|