| Controls, Diagnostics and Beamline Instrumentation Division |
| Control System for Electron Beam Radiation Processing Facility (EBRPF) |
| |
|
Overview of EBRPF Control System
EBRPF is also referred as ARPF (Agricultural Radiation Processing Facility) in some documents. The control system of linac based EBRPF is based on distributed control system architecture, distributed between three layers. Scheme of the control system is shown in figure-1. The control system is implemented using a VME bus based front end controller at the Equipment Interface (EI) layer and a PC based User Interface (UI) layer. User interface layer is implemented using LabView. Third layer is the Network layer (NW) which manages the communication between instruments and authenticates the programs to exchange the data between various modules on the network.
Control system is comprised of two main component modules, the hardware and the software. The hardware component describes the physical interconnection of various signals from the front-ends, their interfacing, processing in electronic hardware and the transfer of the signal information to user layer. The software component describes the processing of the signal information at user interface and the network layer. Presentation of the data on the console panel and human machine interface is also a part of the software along with data logging and their presentation on the web. Figure-1 depicts the overall control system scheme.
|
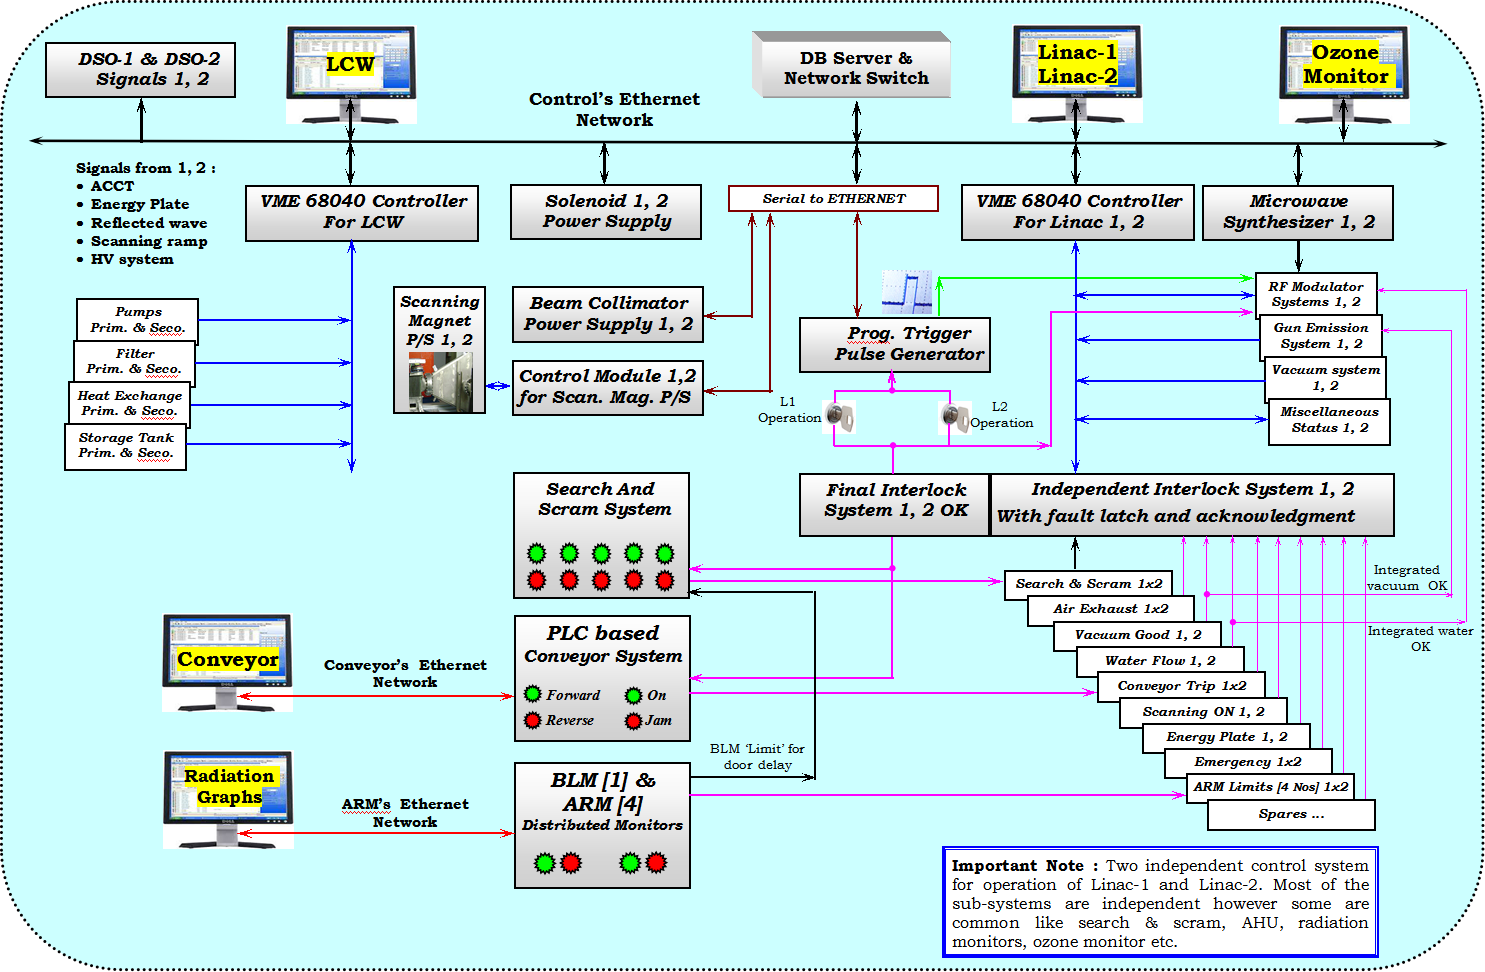 |
| Figure1: Scheme of Control System |
| |
Hardware
The hardware at EI layer of the control system is developed around VME Equipment Controller (EC). It includes the CPU, digital and Analog Input/Output (I/O) modules. The various subsystems at the front end are interfaced to the EC. Various parameters like voltages of the RF system, currents in the magnets, vacuum (pressure) in the linac, status of various power supplies, interlocks, water flow in the devices etc are monitored using the system. Some of the parameters are also controlled from control system.
Signals from various subsystems and the independent parameters are processed using signal conditioning modules that provide galvanic isolation. Signals after conditioning are processed by various VME I/O boards. The VME controller CPU acquires the data from the I/O boards, checks dependencies and bounds, formats the data and transfers the formatted strings to the UI layer. The I/O boards are standard VME module like 32 channel isolated digital input boards, 32 channel digital output boards, 32 channel analog input board and 8 channel analog output boards etc. Multiple I/O boards are used to meet the requirements. Signal conditioning modules are the relay isolation modules for digital I/Os and isolation amplifier modules for analog I/Os.
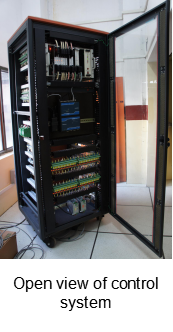
The software modules in the CPU run under an Real Time Operating System (RTOS). The EC is linked to the console over Ethernet. The GUI at user layer (in console PC) interacts with the VME controller closely for overall monitoring and supervision. All the magnet power supplies, RF synthesizer and some other instruments and systems directly communicate to the PC over RS485 serial interface through 485 to Ethernet interface converter. The Equipment Control Station (ECS) contains the maximum hardware of the control system and the same is depicted in figure-2.
|
|
Interlocks are hardwired in a dedicated independent interlock system, which generates trip signals for any abnormal condition. The trip signals puts off the beam in the linac and/or trip some of the subsystems of linac. For personnel safety, there is an independent search and scram system. It gives an interlock signal to the dedicated interlock system module and also independently to RF systems. In case of search failure or a scram signal, it trips off the RF devices and puts off the trigger for electron beam without the intervention of control system. Status of the interlocks and the personnel safety system is read by the VME controller in the control system. Depending on the status of the interlocks from these independent modules, a secondary action on interlock failure is also taken by the VME controller. Status information of the interlocks from these modules is displayed on the operator console monitor along with the other signals.
Programmable Trigger Generator (PTG) Module for Linac
Main Features of PTG:
- Pulse Repetition Rate (PRR) setting range: 1 Hz – 300 Hz
- Adjustable delayed trigger pulse for buncher with respect to master trigger pulse: 2 µS – 2000 µS
- PRR limit set facility as per user requirement with authentication
- Selectable mode Free running / Count mode / Gated mode. Count mode range: 00001 – 30000 count pulses
- One Hz trigger pulse for beam parameters measurement system
- Remote / Local operation for ease of settings
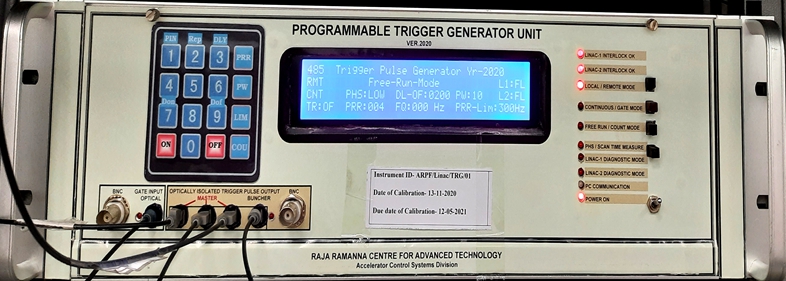
Figure: Snapshot of Programmable Trigger Generator for Linac
Programmable Control Module for Linac Scanning Magnet Power Supply
Main Features:
- Analog ramp reference generation for scanning magnet power supply with 0.05% accuracy
- Reading the positive and negative peak current of power supply read back with 0.05% accuracy
- Scan time measurement with 0.01% accuracy (ramp time and retrace time)
- 8 digital control signals and 8 status read back signals for remote operation of P/S.
- Programmable ramp up time from 100 mS to 1 sec, retrace time from 3 mS to 10 mS.
- four segment ramp reference with individual time and amplitude settings
- Adjustable offset setting (base setting)
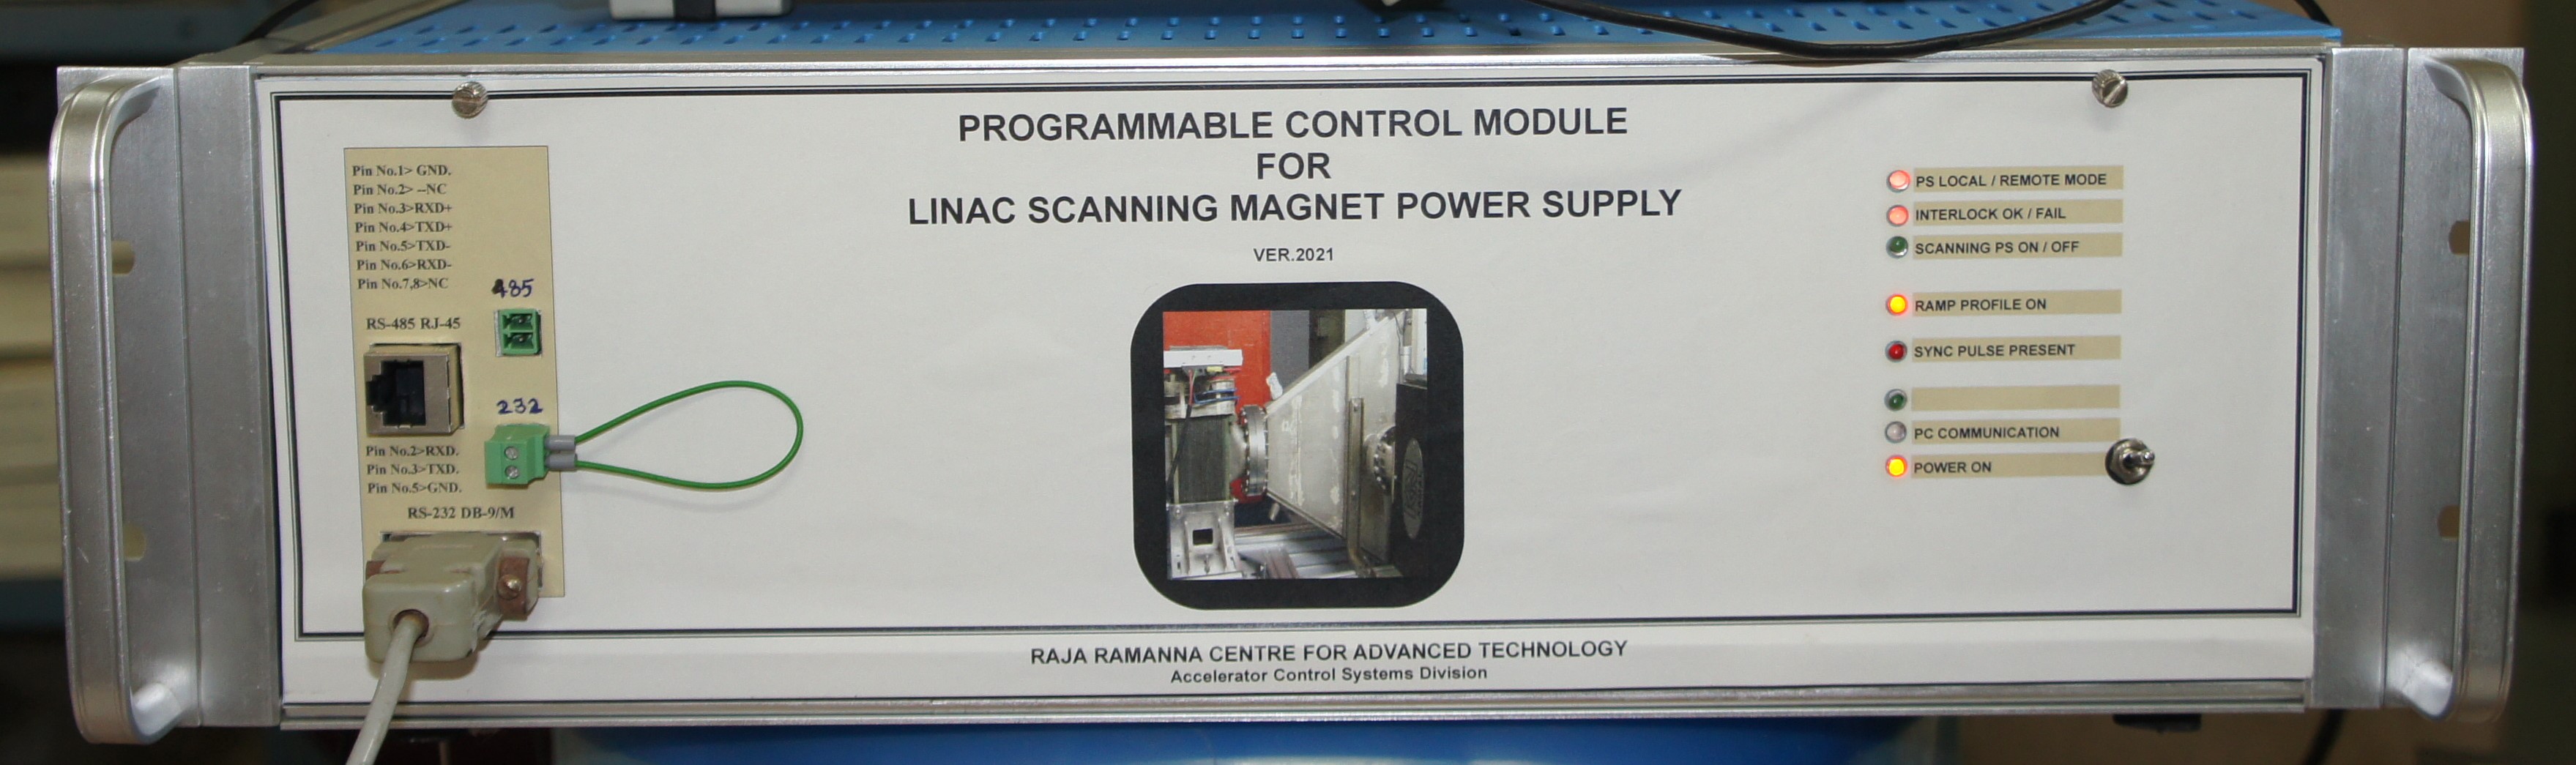
Figure: Snapshot of PCM for SMPS
Software
A complete system of software is designed to operate and supervise the machine. The software system architecture includes distributed acquisition, analysis, data storage and presentation.
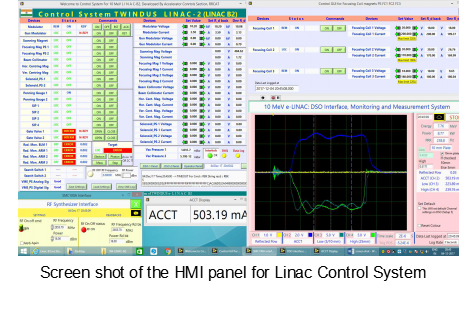
A versatile Graphical User Interface (GUI) at the UI layer running on the main console in the control room communicates with the VME based controller. It presents the data acquired from various subsystems in a user-friendly format. It also facilitates user/operator to take defined actions on various subsystems. The GUI is also modular in the sense that it integrates some other modules for measurement of waveforms and controlling instruments like synthesizer and CROs/DSOs.
Software running at the user interface layer (console PC) is termed as supervisory control system software. It performs functions like data processing, alarm generation, data logging and data acquisition from instruments over network, analysis and presentation of data in GUI (graphical user interface) panels. These software programs are implemented using server-client modules. A server program running on the back of GUI, communicates with the VME controller. All the clients make connections to this server and communicate through standard protocols. The signal information as available with the VME controller is read by the server program. GUI, the client program reads the signal information from the server program and then parses the information in the format understood by user and displays on the GUI in a user friendly format. It also activates alarms on the deviation of parameters more than their defined tolerance limits. The alarms are configurable and are displayed and logged.
|
 |
 |
Various independent standard instruments like DSOs/CROs, synthesizer etc are directly read and controlled by instrument servers programs at UI layer. These instruments are directly connected on Ethernet and communicate with the UI servers using standard TCP/IP protocol.Most of the user interface programming is done in LabView SCADA and Microsoft SQL is used as the central database.
|
 |
|