|
The numerical simulation activity is looked after by Dr. Ajit Upadhyay (ajitup(at)rrcat.gov.in). He performs laser plasma simulations in collaboration with Laser Plasma Division, RRCAT.
Introduction
Laser-plasma Simulations is an indispensable tool in designing experiments and understanding the experimental results. Particle-in-cell (PIC) simulation requires expertise in understanding the codes, formulating simulation problem and post-processing the results. It also requires huge computational resources. Over the last more than a decade, we have gained reasonable expertise in this field.
- 1D, 2D and 3D particle-in-cell (PIC) simulations had been setup for laser plasma interaction.
- These PIC codes VORPAL, EPOCH, SMILIE, PICCANTE and PIConGPU installed on various HPC cluster to cater simulation of particle and field dynamics as well as some type of radiations from plasma. This includes simulations of
- electron acceleration from gaseous targets
- high energy proton acceleration from foil targets
- hot electron generation and transport in metallic targets
- Gamma radiation generation through inverse Compton scattering
- THz generation from two colour lasers
- It is also possible to simulate Bremsstrahlung radiation from laser plasma interaction. All the required simulation diagnostics and post-processing libraries for deducing relevant images have been developed.
- Hydrodynamic simulations using the code MEDUSA and radiation hydrodynamic code MULTI are carried out to study the time and space evolution of plasma density, material density, hot electron transport and electron-ion temperature for long-pulse as well as short-pulse laser plasma interactions.
The codes and the platforms used for these simulations are as follows:
PIC Codes:
- VORPAL-3D (Tech-X Corp., 256 core) - Kshitij-5 HPC cluster -256 core
- EPOCH-3D (unlimited node) installed - 384 core of Kshitij-5 HPC cluster
- SMILIE-3D (unlimited node) installed - 384 core of Kshitij-5 HPC cluster
- PICCANTE-3D (unlimited node) - 96 core Uday HPC cluster
- PIConGPU-3D (unlimited node) - 2 GPUs of Kshitij-5 HPC cluster
Hydrodynamic / Fluid Codes:
- Multi – 2D - NSL workstation
- MEDUSA 103 - NSL workstation
Simulation of Electron and Ion Acceleration
The commercially available PIC code VORPAL and collaborative PIC code EPOCH are installed on computing cluster Kshitij-5. The 256 cores of Kshitij-5 was used to carry out 2D simulations using the code VORPAL and, 2D and 3D simulations using the code EPOCH are carried out at 384 cores of Kshitij-5 in time-sharing mode with VORPAL. The open-source GPU code PIConGPU is installed on Kshitij-5 to carry out studies on charged particle acceleration as well as radiations from laser plasma interaction. Some of the published simulation results of electron acceleration are shown below.
 Simulations of gamma ray generation using femtosecond intense laser pulses:
Numerical simulations were carried out using a particle in cell (PIC) code PIConGPU to study the generation of gamma rays using inverse Compton scattering process in laser produced plasmas (schematic shown in fig 1). Inverse Compton scattering between ultra-relativistic electrons and an intense laser field is one of the major routes to generate compact high-brightness and high-energy γ-rays. An all-optical Compton scattering γ-ray source, using a single laser to both accelerate electrons, and for conversion to γ-rays has inherent synchronization between accelerated electrons and scattering laser pulse. In the ICS process, the electrons of laser produced plasma are first accelerated to energy of several MeV through a mechanism known as laser wake field acceleration (LWFA). Subsequently, these relativistic electrons (relativistic factorγ) are made to collide with a laser pulse (frequency ωL). These electrons transfer a fraction of their energy to the incoming photons which are scattered in the direction of flight of electrons, with a Doppler upshifted frequency ω ~ 4γ2 &omegaL. The resulting photon energy ћω is ~ 1.5 MeV for electrons of 250 MeV energy.
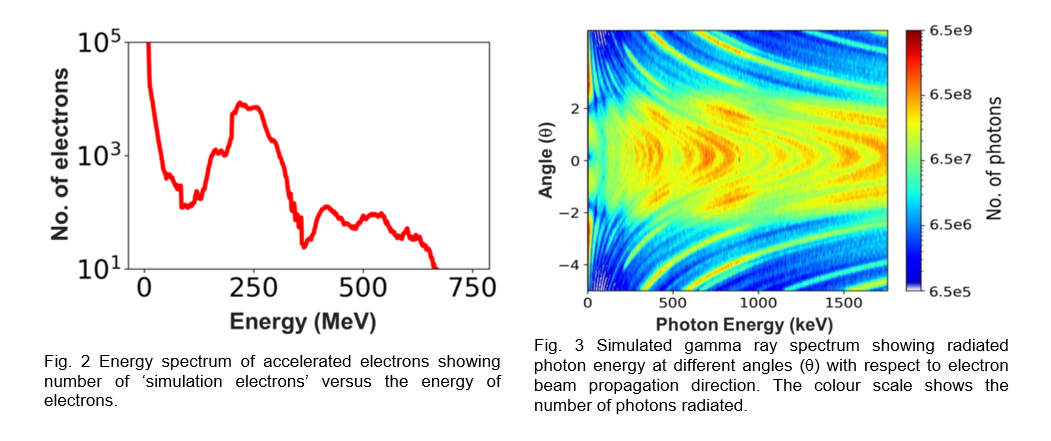
As part of these simulation studies, the laser and plasma parameters were first optimized through simulations to obtain accelerated electrons of quasi-monoenergetic energy ~ 250 MeV. The optimized laser pulse duration is 25 fsec and laser intensity is 2.6 x 10¹⁹ W/ cm2. The laser is focussed to a spot of 18 µm diameter in a gas jet where the initial part of the laser interacts with the gas to form plasma of density 7x1018cm-3. The electron energy spectrum obtained from these simulations is shown in fig 2, the energy spectrum has a peak at 250 MeV ± 35 MeV with few electrons accelerated up to 650 MeV energy.
Then in the next step, we calculated the gamma radiation emitted through ICS by these quasi-monoenergetic 250 MeV ± 35 MeV electrons when they collide with another laser pulse (25 fsec, 1018 W/cm2. The simulations calculated the angular distribution of gamma radiation at different photon energies. Gamma ray photons (> 107 photons) up to energy 1.75 MeV are observed within an emission cone of ±2 degrees from the direction of propagation of electron bunch as shown in fig 3. The emitted radiation shows several peaks in photon energy due to numerical binning effects in particle energy as well as radiation calculation at discrete angles. Also, in these calculations the grid size and time-step are chosen sufficiently small so as to keep the numerical noise very low.
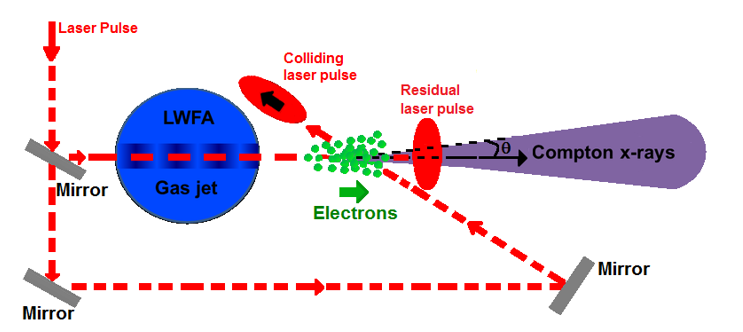
Fig. 1 Schematic of Inverse Compton Scattering (for maximum Compton photon energy the collision between accelerated electrons and second laser pulse is done at 1800).
Some of the recent publications (since 2022) of the laboratory are:-
- “Addressing key aspects of J×B driven MeV fast electron generation in ultra-short ultra-intense laser foil interaction”, T. Mandal, V. Arora, A. Moorti, A. Uphadhyay, and J. A Chakera, Phys. Plasmas 30, 023106 (2023);
- “Terahertz radiation from semiconductor plasmas using extraordinary mode of lasers”, K Gopal, A P Singh, M Kundu, A Upadhyay and P Varshney, submitted to Optik (2023)
- “Electron beam acceleration using Colliding pulses injection in parabolic plasma channel”, D. Phadte, A. Upadhyay, Y.B.S.R. Prasad, Optik - International Journal for Light and Electron Optics 265 (2022) 169402
- “Effect of laser intensity redistribution on semiconductor plasma based THz emission”, P. Varshney, A.P. Singh, A. Upadhyay, M. Kundu, K. Gopal, Optik - International Journal for Light and Electron Optics 250 (2022) 168353.
- “Numerical Studies on Controlled Trapping and Acceleration of Electron Bunch on a Gaussian Density Down Ramp”, D. Phadte, K. Madhubabu, A. Upadhyay, S. R. Mishra, 37th National Symposium on Plasma Science & Technology (PLASMA 2022), IIT Jodhpur, Dec 2022.
- “Effect of thin Gold (Au) coating on proton acceleration from a transparent Mylar foil target”, M. Tayyab, S. Bagchi, A. Upadhyay, A. Moorti and J. A. Chakera, DAE-BRNS National Laser Symposium (NLS-30), Bhabha Atomic Research Center, Mumbai-400085, Maharashtra, India, 2022.
- “Study of laser polarization dependant JxB acceleration in relativistic ultrashort laser foil interaction”, T. Mandal, V. Arora, A. Moorti, A. Uphadhyay, and J. A Chakera, DAE-BRNS National Laser Symposium (NLS-30), Bhabha Atomic Research Center, Mumbai-400085, Maharashtra, India, 2022.
Hydrodynamic Simulation: Role of target material in proton acceleration from thin foils irradiated by ultra-short laser pulses
Using the one dimensional hydrodynamic code MULTI-1D, we have studied the propagation of the shock wave caused by the ASE pre-pulse inside the foil. A 1.5 ns duration ASE pre-pulse with temporal shape exactly matching with the experimentally measured value of our 10TW laser and having a peak intensity of 2×10¹² W/cm2 (obtained from the measured contrast of the laser pulse) was used in the simulation. Fig. 1 shows the density profiles at the end of the pre-pulse for Al foils of different thickness. The “+” mark on each curve shows the initial position of the rear surface of foil. Wherever the rear surface survives (either in solid or a solid-liquid mixed phase) after the pre-pulse, the same has been shown in figure with a dotted vertical line. In some cases, the rear surface seems to have shifted during the laser pre-pulse, which is due to conservation of total mass, as the foil has melted and expanded in 1D code. The dash-dot horizontal line shows the density of solid Al (2.7 g/cm2). As seen from this figure, for 1.5 μm and 1 μm Al foil, the whole foil gets vaporized and no rear surface exists. For the 2 μm thick foil, a small region with gas-vapour mixture occurs inside the rear surface. It is clear that for the foil thicknesses < 2.5 μm, the rear surface of the foil evaporates (note the overall reduction in density as compared to pristine density 2.72 gcm-3). As the thickness is increased, till 6 μm, the rear surface appears to survive. However, for higher foil thicknesses >6 μm, the rear surface is not perturbed. Thus, for thicknesses less than 6 μm, the proton energy/flux decreases due to pre-plasma formation on the rear side of the foil. For higher thicknesses, the absorption of the hot electrons within the foil increases and the proton flux decreases. Therefore, the Al foil of 6.5 μm comes out as an optimal foil thickness for efficient acceleration of ions, as is observed in experiments
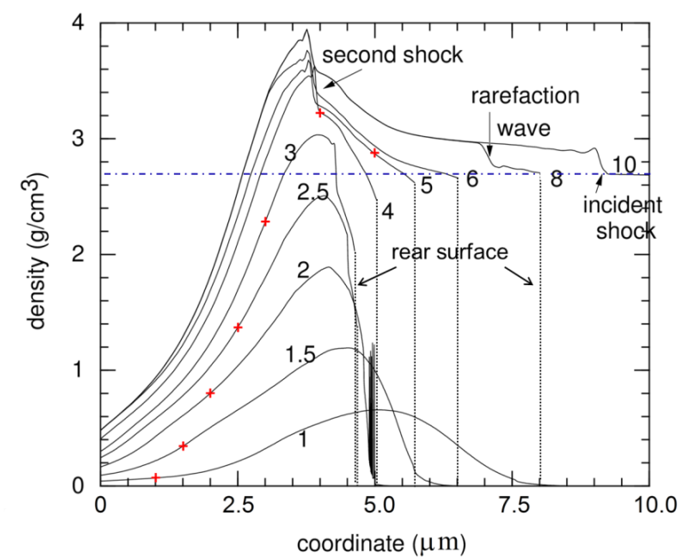
FIG. 1: 1-D hydrodynamic simulation of the electron density evolution in the foil and the shock wave caused by a 1.5 ns ASE pre-pulse with intensity 2 x 10¹² W/cm2, for Al foils of different thicknesses.
The role of laser pre-pulse is expected to be different for different target material as the shock pressure and the shock velocity strongly depend on target atomic number and density. Therefore, in order to mitigate the effect of laser pre-pulse, a Ni foil was used. Figure 2 shows the one dimensional hydrodynamic simulation of density evolution and the shock wave caused by a 1.5 ns ASE pre-pulse with intensity 2x10¹² W/cm2 for Ni foils of different thicknesses. We can see that for foil thicknesses below 0.5 µm, the foil is completely destroyed and no rear surface exists. One may note the overall reduction in the density, as compared to the pristine density of 8.91 gm/cm3). For 1 µm foil, the shock wave just reaches the rear surface causing slight vaporization, whereas the 2 µm foil rear surface looks intact, unaffected by the laser pre-pulse. Therefore, for Ni target, 1-2 µm seems to be optimum thickness.
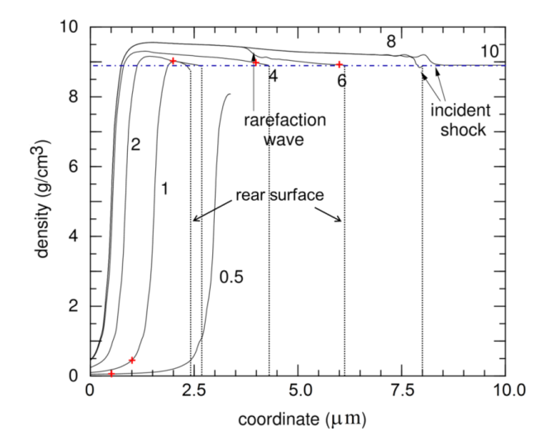
FIG. 2: One dimensional hydrodynamic simulation of density evolution and the shock wave caused by a 1.5 ns ASE pre-pulse with intensity 2x10¹² W/cm2, for Ni foils of different thicknesses
|


 Home Laser Physics Applications Division


