| Indus-1 Beamlines |
|
High Resolution Vacuum Ultraviolet (HRVUV) Beamline |
Introduction
A High Resolution Vacuum Ultraviolet (HRVUV) beamline has been set up at Indus-1 by Atomic and Molecular Physics Division, BARC. This beamline is useful for photoabsorption studies of atoms and molecules in the wavelength region of 1050-3000 Å (3.5-11.8 eV). The beamline consists of three major components: a pre-focusing optical system, a gas phase absorption setup and a 6.65 m vacuum ultraviolet spectrometer in off-plane Eagle mount. The performance of the beamline has been evaluated by recording VUV absorption spectra of Xenon, Oxygen and Sulphur dioxide using synchrotron radiation from Indus-1. The resolution achieved is ~0.1 Å with a 1200 ln/mm grating. The beamline has been commissioned and is in operation since June 2010.
|
|
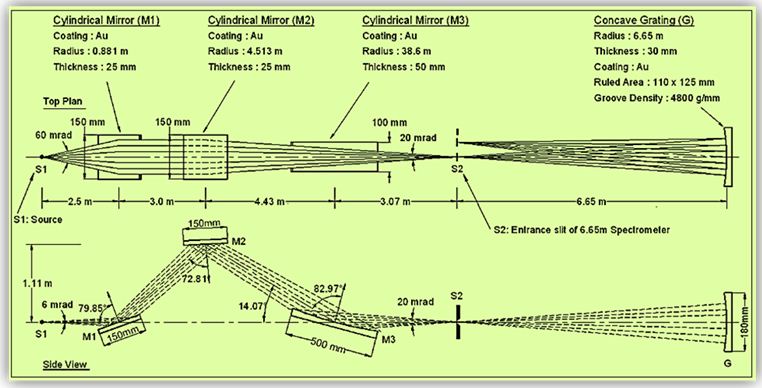
Fig. 1: Schematic Optical layout of HRVUV beamline |
| |
 |
- Range: 1050-3000 Å
- Resolution: 0.1 Å (1200gr/mm)
- Resolving Power: 15000
- Photon flux: 108-109 ph/s
|
Fig. 2: Schematic of 6.65m off-plane Eagle mount spectrometer |
|
The optical layout of the beamline is illustrated in Fig.1. The choice of the pre-dispersing optical system is such that it maximizes the throughput in the VUV region and effectively matches the source aperture to the spectrometer aperture within constraints imposed by the source, space availability and cost. The vertical and horizontal acceptance angles of the beamline are 6 and 60 mrad respectively. The designed acceptance angles of the spectrometer for the entrance beam are 20 mrad × 20 mrad. It is therefore necessary to expand the SR beam by a factor ~ 3.3 in the vertical direction and compress by a factor 3 in the horizontal direction to ensure full illumination of the grating aperture. This is achieved by the focusing system consisting of three concave cylindrical mirrors (M1, M2 and M3) as shown in Fig.2. The parameters of these mirrors are given in Table-1.
| Table 1: Parameters of Mirrors |
Cylindrical mirror |
Dimensions in mm |
Radius of curvature |
Focal length
f
|
Angle of incidence
(θ) |
Reflective Coating |
M1 |
150 × 150 × 25 |
0.881 m |
2.7 m |
79.85° |
Gold |
M2 |
150 × 150 × 25 |
4.513 m |
7.6 m |
72.81° |
Gold |
M3 |
100 × 500 × 50 |
38.6 m |
3.07 m |
82.97° |
Gold |
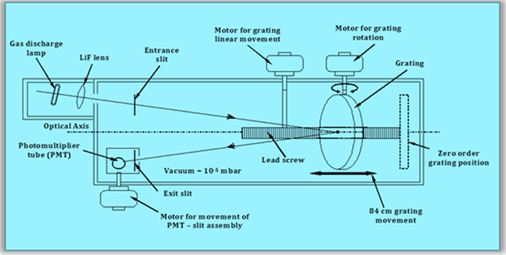
A schematic diagram of the optical arrangement of the spectrometer is shown in Fig.2. The spectrometer is based on off-plane Eagle mounting utilizing a concave spherical grating of radius of curvature 6.65 m. The parameters of the two gratings used in the spectrometer are given in Table-2. For selecting a particular wavelength, the grating is rotated about the horizontal axis passing through its pole and parallel to the entrance and exit slits. It is then translated along the axis of the spectrometer in order to focus the dispersed wavelength on the Rowland circle. The spectrum is scanned by moving the exit slit and photomultiplier (PMT) assembly vertically along the focal plane. The linear and rotational motion of the grating and the linear motion of PMT are controlled by a 3-axis stepper motor controller and driver system. We use sodium salicylate coated quartz window mounted at the exit slit of the spectrometer to convert the VUV radiation into visible radiation, which is then detected by a PMT.
Table 2: Parameters of Gratings |
| Ruling |
4800 ln/mm |
1200 ln/mm |
| Coating |
Gold |
Al + MgF2 |
| Diameter of blank |
180 mm |
210 mm |
| Ruled area |
125 mm × 110 mm |
125 mm × 110 mm |
| Blaze angle |
13° 52' |
5°10' |
| Blaze wavelength |
1000 Å |
1500 Å |
| Linear dispersion |
0.3 Å/mm |
1.24 Å/mm |
| Wavelength coverage |
500-2000 Å |
1150-6000 Å |
| PMT Scanning Range |
50 Å |
200 Å |
|
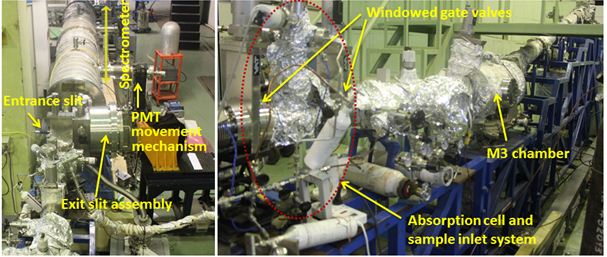
Fig. 3: Photograph of HRVUV beamline showing 6.65 spectrometer, fore-optics and absorption cell |
Experimental Station
|
|
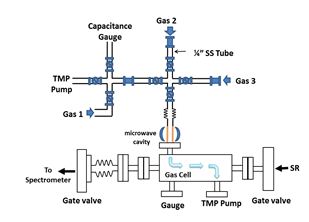
Fig. 4: Schematic of photoabsorption setup |
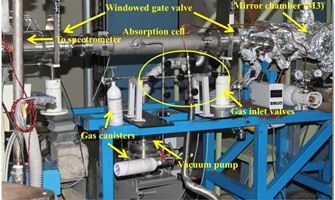
Fig. 5: Gas phase absorption cell |
For photoabsorption studies, a 0.5 m stainless steel absorption cell is placed between the entrance slit of the spectrometer and beamline fore-optics. The broad band SR beam from the Indus-1 source passes through the three cylindrical mirror fore-optics system and subsequently through the absorption cell before getting focused onto the entrance slit of the spectrometer. The cell is isolated from the spectrometer and the beamline optics by two ultrahigh vacuum (UHV) windowed gate valves fitted with LiF windows and is equipped with a gas filling system consisting of several ports for pumping, introduction of gases and pressure measurement. A system of Swagelok needle valves is used to regulate the flow of gaseous samples and capacitance manometers are used to accurately measure the sample pressure.
Some specialized experiments like VUV absorption studies of transient species/radicals produced in a discharge require short recording times due to drifts in experimental conditions. An alternative image plate (IP) based position sensitive detection method has been developed which is highly sensitive and can detect low signals and record maximum possible wavelength region (~200 Å) in a very short time (~1-60 s). The IPs are mounted on a multi-plate holder which is a hexagonal stainless steel rod with six faces of dimension 1.5 cm × 25 cm mounted on a flange and inserted from a port on top of the scanning chamber. One can rotate the hexagonal rod in vacuum by means of a simple Wilson seal rotary feedthrough mechanism, such that one face at a time is exposed to the dispersed radiation from the grating. For experiments which require PMT detection, it is easily possible to revert back to the scanning mechanism.
Some Results
a. VUV absorption spectra of Xe, O2, SO2 & N2O:
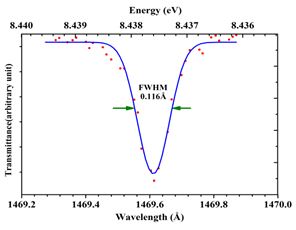
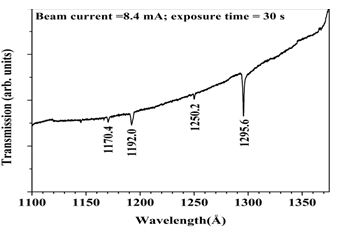
The atomic absorption line of Xenon at 1469.61 Å used to ascertain the reproducibility and resolution of the spectrometer and also as a calibration standard is shown in Fig.6. The wavelength reproducibility is found to be within ± 0.01 Å. A measured line width (FWHM) of 0.12 Å is observed for the 1469 Å line, which demonstrates the resolution capability of the instrument. The four Xe atomic lines at 1170.4, 1192.0, 1250.2 and 1295.6 Å (cf Fig.7) are recorded using IP detection system at a central wavelength setting ( λ c) of 1235 Å.
|
|
Fig. 6 Absorption spectrum of 1469.61� line of Xe using PMT detection system. |
Fig. 7: Atomic absorption lines of Xe recorded using IP detection system. |
The Schumann-Rungé system of O2 is often used as a benchmark to test the performance of VUV spectrometers. This band system in the wavelength region 1780 – 1880 Å obtained with the 1200 ln/mm grating is shown in Fig.8 using IP (exposure time of 30 seconds) and PMT detection system. The vibrational band heads corresponding to (v′, v″) are marked on the figure (where v′ and v″ are the vibrational quantum numbers of the excited and ground states respectively.
|
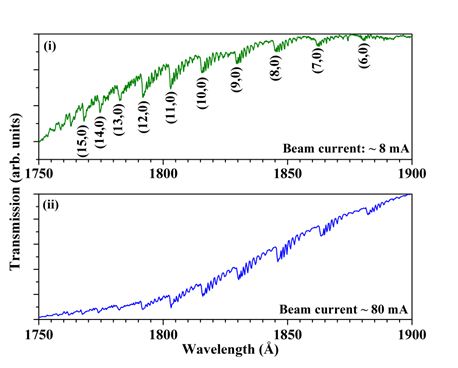 |
Fig. 8: Schumann Rungé bands of O2 (P ~ 4 mbar) in the wavelength range 1750–1900 Å recorded on HRVUV beamline using (i) IP and (ii) PMT detection system. |
|
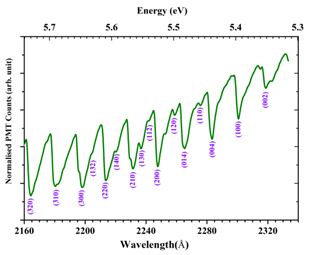
Absorption spectrum of the SO2 molecule in the wavelength region 2160-2340 Å (part of the X1 A1->1B2 system) recorded using PMT detection system is shown in Figs. 9 with major vibronic transitions marked. The convention followed for assignments of absorption features is (aν1, bν1, cν1); where a, b and c are the number of quanta of vibrational energy in the excited electronic state.
|
Fig. 9: Absorption spectrum of X1 A1->1B2 system of SO2 |
| |
|
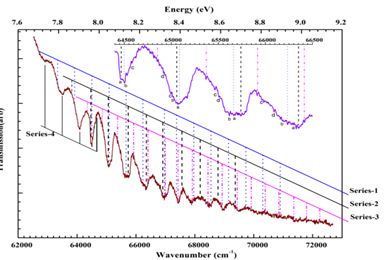
The absorption bands seen in the 1420 – 1620 Å region form part of the E"-X" system extending from about 1378 – 1620 Å. Most of the observed bands fit into four series with successive band spacing of 500 – 620 cm-1 and two additional series with average separation of ~1750 and ~1000 cm-1.
|
|
| |
Fig. 10: Absorption spectra of E"-X" system of SO2 |
| |
|
|
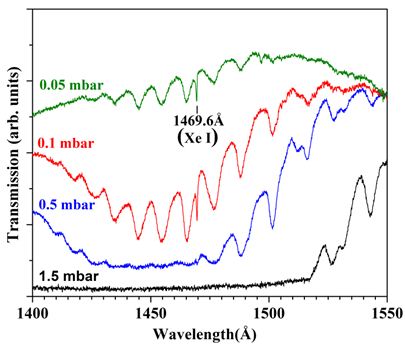
A pressure dependent photoabsorption study of the ÍC1Π-X"1Σ+ system of N2O recorded at fixed central wavelength 1469 Å using the multi-plate IP holder is shown in Fig. 11. This study demonstrates the utility of the multi-plate holder in performing multiple experiments in a short time during which parameters like beam current do not change appreciably. |
Fig. 11: Photoabsorption spectrum of N2O in the 1400-1550 Å region at several pressures recorded on HRVUV beamline using IP detector. Xe line is used as a calibration standard. |
|
b. Calibration of Lyman Alpha Photometer (LAP) for Mars Orbital Mission (MOM):
(In collaboration with LAP team from LEOS, ISRO Bangalore headed by Dr. M. Viswanathan)
Lyman Alpha Photometer (LAP) is one of the scientific instruments of the payload on MOM spacecraft, which is India's maiden mission to the red planet, Mars.
Lyman Alpha Photometer:
The electronic transition from n=2 to n=1 energy level in a hydrogen atom is called Lyman Alpha emission. Photometer is an instrument for measuring intensity of light. Lyman Alpha Photometer is a resonant absorption cell photometer.
LAP measures the relative abundance of deuterium and hydrogen from Lyman-alpha emission in the Martian upper atmosphere. Measurement of D/H (Deuterium to Hydrogen abundance ratio) will improve our understanding of the process involved in the loss of water from the planet. The estimated D/H ratio will be used in MGCM (Mars General Circulation Model) algorithms to assess the present water escape rate from the Martian exosphere.
In upper atmosphere hydrogen and deuterium atoms are produced by photo dissociation from H2O and HDO molecules. The D/H ratio in the atmosphere increases with time because escaping rate of H atoms is expected to be greater than that of D atoms due to the mass difference.
LAP operates on the principle of resonant scattering and absorption at Lyman alpha wavelengths of H and D i.e., 1215.67 Å, 1215.34 Å respectively. Thermally dissociated H2 and D2 molecules using a heated tungsten filament produce H/D atoms which absorb the incoming H/D Lyman alpha radiation incident on the cell. The absorption rate (or absorption cross section) of hydrogen Lyman α is a function of hydrogen gas pressure and filament temperature. A 15 Å bandwidth Lyman Alpha Filter placed in the front of the detector cuts-off the undesirable radiation that lies outside the wavelength range of interest and a solar-blind side-on type photo multiplier tube (PMT) is selected for photon detection.
Measurement Procedure:
The principle of detecting the kinetic temperature of hydrogen is to utilize the resonant transmission property of the absorption cell, which can be mathematically expressed as the convolution of the incident emission and the absorption cell profile. Hydrogen molecules never absorb the Lyman α emission at static condition. However, by activating the filaments inside the cells, thermally dissociated hydrogen (or deuterium) atoms are generated. Then the generated hydrogen (deuterium) atoms resonantly scatter incident Lyman α emission. Since resonantly scattered photons are re-directed omnidirectional, the photons except for those in the direction of the optical axis cannot reach the detector. Consequently, the absorption cell works as a narrow-width negative optical filter which exclusively absorbs the Lyman α emission. By controlling the electric current of the filaments inside the cell, the absorption cell profiles (i.e., relative resonant absorption cross section) are controlled. The absorption efficiencies of the cell are usually measured by varying the filament temperature and the pressure of the gas filled in the cell.
|
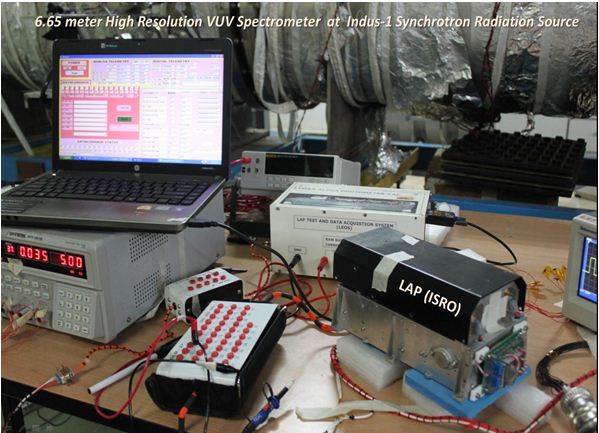
Fig. 13: Lyman Alpha Photometer of ISRO used for calibration experiments |
Important aspects of the LAP calibration experiment
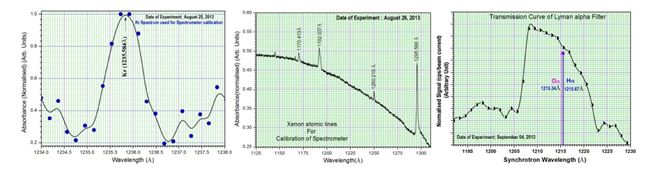
- Calibration of input wavelength source (In this case, wavelength calibration of 6.65 meter HRVUV spectrometer was carried out using standard atomic absorption lines of Xe and Kr with Indus-1 SRS).
- Measurement of spectral transmission profile of Lyman Alpha Filter and its band width.
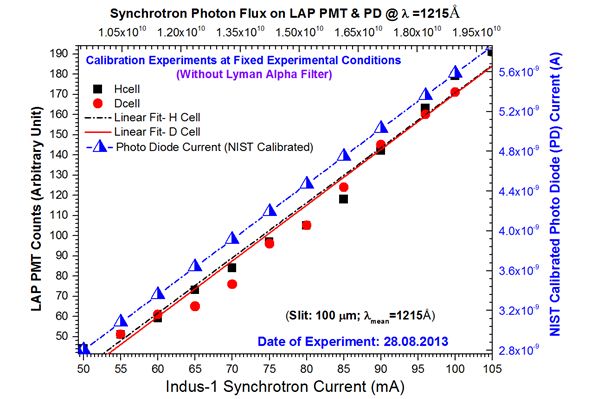
- Measurement of photon flux of synchrotron at the desired mean wavelength using a NIST calibrated photo-diode.
- Measurement of linearity and signal sensitivities of PMT used in LAP system.
- Characterization of Hydrogen and Deuterium cells for their resonant responses during filament OFF and ON conditions at precise input wavelength of Hα (1215.67 Å) and Dα (1215.34 Å) lines.
Some of the results obtained during calibration experiments:
|
Fig. 14: Calibration of 6.65 meter HRVUV spectrometer using standard atomic absorption lines of Xe and/or Kr and measurement of spectral response of Lyman Alpha Filter. |
| |
|
Fig. 15: Measurement of linearity and signal sensitivities of PMT used in LAP system at mean wavelength 1215� and Computed Photon Flux through NIST Calibrated Photo Diode. |
Publications
Journals
- Photostimulated phosphor based image plate detection system for HRVUV beamline at Indus-1 synchrotron radiation source;
K. Haris, Param Jeet Singh, Aparna Shastri, Sunanda K., Babita K., S.V.N. Bhaskara Rao, Shabbir Ahmad and A. Tauheed;
Nuclear Instruments and Methods in Physics Research-A 767 (2014) 199-205.
- VUV Photoabsorption Spectroscopy of Sulphur Dioxide in the 1400 -1600 Å Region: Vibronic Analysis of the E-X System;
Param Jeet, Singh, Aparna Shastri, R. D’Souza, S.V.N. B. Rao and B.N. Jagatap;
J Quant Spectrosc Radiat Transf. 113 (2012) 267-278.
- Excited state vibrational modes of a few triatomic molecules of environmental interest.
Aparna Shastri, Sunanda K., Param Jeet Singh, B.N. Rajasekhar, S.V.N. Bhaskar Rao, R. D’Souza and B.N. Jagatap;
Asian Journal of spectroscopy special issue (2012) 107-119.
- First Commissioning Results from High Resolution Vacuum Ultraviolet Beamline at Indus-1 Synchrotron Source;
Param Jeet, Singh, Aparna Shastri, R. Sampath Kumar, S.N. Jha, S.V.N. B. Rao, R. D’Souza and B.N. Jagatap;
Nuclear Instruments and Methods in Physics Research-A 634 (2011) 113-119.
- Development of a 6.65 m off-plane Eagle spectrometer for a high resolution vacuum ultraviolet beam-line at Indus-I synchrotron radiation source:
N.C. Das, R.P. Shukla, D.V. Udupa, N.K. Sahoo, D. Bhattacharya, K. Sunanda, P. Saraswathy, Sampath Kumar, A.K. Sinha, S. Bhat, V.C. Sahni,
Current Science 87 (2004) 1523-1529.
Symposia/Conferences
- VUV Spectroscopy of Environmentally Important Molecules in Gas Phase and Matrix Isolated Phase Using Synchrotron Radiation;
Param Jeet Singh, Anuvab Mandal, Vijay Kumar, Aparna Shastri, K. Sundararajan, B.N. Raja Sekhar and B.N. Jagatap.
Invited Talk at National Symposium on Radiation and Photochemistry, North East Hill University, Shillong, 22-24 March, 2013.
- VUV photoabsorption studies of DMSO using synchrotron radiation;
Anuvab Mandal, Param Jeet Singh, Aparna Shastri, S.V.N. Bhaskara Rao, B.N. Jagatap;
Poster at DAE-BRNS Symposium on Atomic, Molecular & Optical Physics-AMOP-2012, IISER, Kolkata, 14-17 December, 2012.
- Probing vibronic structure of highly excited states of polyatomic molecules using synchrotron radiation;
B.N. Jagatap, Aparna Shastri, Param Jeet Singh, Anuvab Mandal and B.N. Raja Sekhar,
Presented at 10th Asian International Seminar on Atomic and Molecular Physics 2012, National Dong-Hwa University, Taipei, Taiwan, 23-30 October, 2012.
- VUV Absorption Spectrum of the E-X System of SO2;
Param Jeet Singh, Aparna Shastri, S.V.N. Bhaskara Rao and R. D’Souza;
Poster at DAE-BRNS Symposium on Atomic, Molecular and Optics physics, Karnataka University, Dharwad, 22-25 Feb, 2011.
- Preliminary results of VUV photoabsorption studies on the HRVUV beamline at Indus-1;
Param Jeet Singh, S.N. Jha, R. D’Souza, D.V. Udupa, Aparna Shastri, Sampath Kumar, SVNB Rao, A. Sinha, S. Bhatt;
Poster at Topical Conference on Interaction of EM Radiation with Atoms, Molecules & Clusters, RRCAT, Indore, 3-6 March, 2010.
- Control and data acquisition system for the PMT scanner of HRVUV spectrometer on INDUS I synchrotron radiation source;
R. Sampathkumar, S. Ajayakumar, S.P. Somkuwar, Param Jeet Singh, S. N. Jha, S. Bhat, A.K. Sinha, R. D’Souza and S.V.G. Ravindranath;
Poster at National Conference on Emerging Technologies in Electronics, Mechanical and Computer Engineering, IIST, Indore, 17-18 April, 2010.
- High Resolution VUV Spectrometer at the INDUS-1 Synchrotron Source;
N.C. Das, R.P. Shukla, D.V. Udupa, N.K. Sahoo, D. Bhattacharyya, K. Sunanda, P. Saraswathy,
AIP Conference Proceedings vol. 879 of international conference on synchrotron radiation instrumentation, Daegu, Korea, 28 May - 2 Jun, 2006
BARC External Reports
- Development of high-resolution vacuum ultraviolet beamline at Indus-1 synchrotron source.
R.P. Shukla, N.C. Das, D.V. Udupa, P. Saraswathy, K. Sunanda, S.N. Jha, Aparna Shastri, Param Jeet Singh, Monika Mallick, A.P. Mishra and N.K. Sahoo; BARC/2005/E/16
Contact persons
Dr. Aparna Shastri
A.M.P.D, BARC, Trombay,
Mumbai - 400 085.
Tel: +91 22 2559 0343
Email: ashastri(at)barc.gov.in |
Mr. Param Jeet Singh
A.M.P.D, BARC, Trombay,
Mumbai - 400 085.
Tel: +91 22 2559 2995
Email: singhp(at)barc.gov.in |
Dr. (Smt.) Shilpa Tripathi
Email: shilpatripathi(at)rrcat.gov.in |
Shri Kiran Kumar Gorai
Email: kkgorai(at)rrcat.gov.in |
|